
Table of Contents
You’re Tracking More Data Than Ever. So Why Is It Still Hard to Get Clear Answers?
Most service businesses aren’t struggling with a lack of data.
Your teams track time. Projects generate status updates. Managers review utilization reports. Finance teams monitor revenue and costs.
Yet when you answer, the picture is often unclear.
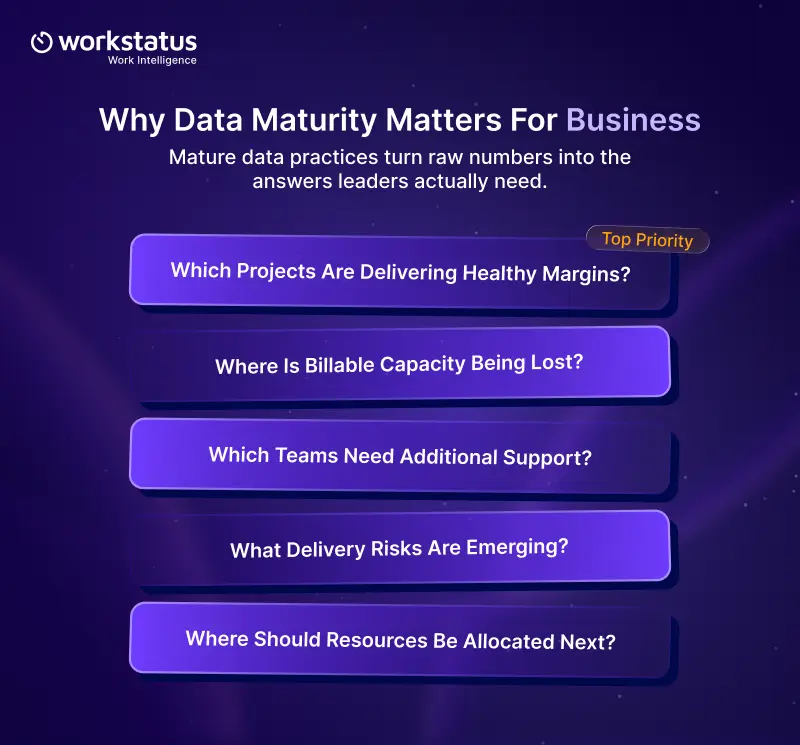
- Which projects are actually making money?
- Where is billable capacity slipping away?
- Which teams are stretched too thin?
- What delivery risks are building before they become client problems?
The challenge isn’t collecting information.
It’s connecting information in a way to help you make better decisions.
When visibility is limited, problems are usually discovered too late
They often get discovered after margins shrink, deadlines slip, or resources become overloaded.
The businesses that perform best aren’t necessarily collecting more data. They’re getting more value from the data they already have.
That’s where data maturity comes in.
A data maturity model helps you move from tracking activity to making smarter decisions.
Why Data Maturity Matters for Service Businesses
According to research by McKinsey Global Institute, data-driven organizations are 23 times more likely to acquire customers, 6 times more likely to retain customers, and 19 times more likely to be profitable.
Most service businesses already have the data they need. However, the data is spread across different systems. One tool is used for time tracking, while another is used for tracking project performance
In such a scenario, when leaders need to make decisions, they first have to piece together information from multiple sources
That’s when problems start.
- Projects lose margin before it is noticed.
- Teams become overloaded
- Resources sit underutilized.
- Capacity planning becomes guesswork.
- Delivery risks appear only after timelines slip.
Many organizations respond by creating more reports. However, more reports rarely create more clarity.
What you need is a way to connect workforce activity, project performance, and business outcomes.
That is why data maturity matters.
Workforce intelligence software provides the data intelligence needed to gain a deeper understanding of day-to-day performance and business operations.
The Journey From Time Logs to Business Decisions
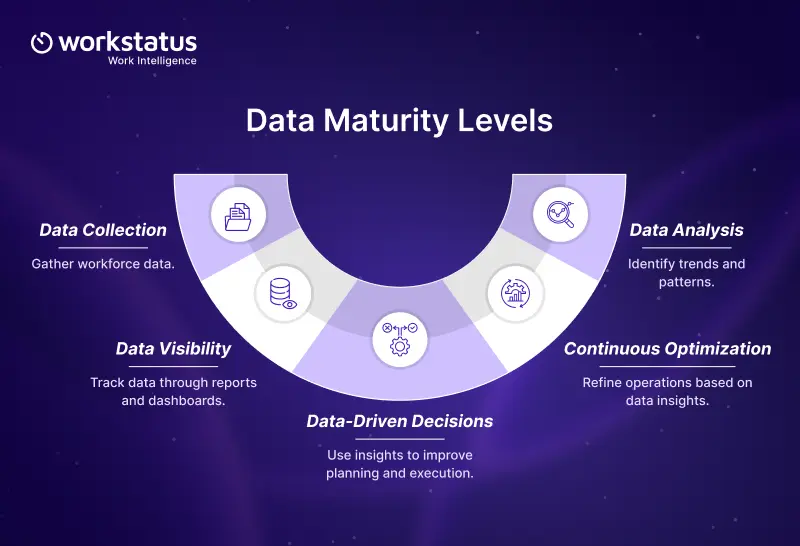
Most organizations follow a similar path.
They begin by gathering data to support payroll, billing, and reporting.
Over time, they learn how to use that same information to improve planning, delivery, utilization, and profitability.
The goal isn’t to collect more data. The goal is to get better answers from the data you already have.
Stage 1: Tracking Work
Every organization is collecting time-tracking data.
The focus is recording workforce activity.
This usually includes:
- Timesheets
- Attendance records
- Project hours
- Task activity
- Billing information
At this stage, you can answer basic questions:
- Who worked?
- How many hours were logged?
- Which projects received those hours?
These records help run payroll and billing.
They don’t explain whether work is being delivered efficiently, resources are being used effectively, or projects are profitable.
Stage 2: Building Visibility
Once workforce data is collected consistently, you need to start looking beyond hours worked.
The focus shifts to understanding how work is distributed across the business.
Organizations begin tracking:
- Team workloads
- Project progress
- Capacity levels
- Resource allocation
Managers can identify overloaded teams, unused capacity, and projects that are starting to drift off plan.
Small issues become visible earlier, before they affect delivery timelines or margins. Many service businesses start using workforce analytics at this stage to better understand workloads, capacity levels, and employee productivity across teams.
Stage 3: Connecting Work to Business Results
This is where data starts becoming far more useful.
Instead of measuring activity, you begin measuring outcomes such as
- Delivery efficiency
- Team performance
- Capacity utilization
- Client profitability
- Billable utilization
- Project performance
The focus shifts from tracking effort to understanding impact.
It helps you gain a clearer view of what drives profitability, delivery performance, and growth.
This is where service business analytics starts creating measurable value. Businesses evaluate project profitability, client margins, utilization, and delivery performance
Many of them also use productivity analytics to identify work patterns that affect delivery timelines and operational efficiency.
Stage 4: Looking Ahead
Most organizations spend a lot of time reviewing what already happened.
More mature organizations use data to understand what is likely to happen next.
At this stage, one can identify:
- Capacity shortages
- Hiring requirements
- Delivery delays
- Resource bottlenecks
- Budget risks
Teams can address issues before they affect clients or project outcomes.
It helps teams plan more accurately, and delivery becomes more predictable.
A strong data maturity framework helps ensure predictions are based on actual workforce and project data rather than assumptions.
This stage represents a major shift toward proactive data-driven decision-making.
Stage 5: Making Data Part of Everyday Decisions
At the highest level of maturity, data becomes part of daily operations.
You don’t need to wait for weekly reviews or monthly reports to understand what’s happening. They use advanced work intelligence software to gain ongoing visibility into:
- Resource capacity
- Utilization trends
- Project performance
- Team workloads
- Delivery risks
Decisions happen faster because the information is already available. At this stage, data isn’t simply reporting on the business. It’s helping run the business.
This is where business intelligence for service businesses delivers the greatest value. Decision-makers use workforce, project, and financial data to support everyday operational decisions.
How to Advance Your Data Maturity
Improving data maturity doesn’t require collecting more information.
Most service businesses already have plenty of data. The challenge is making it useful.
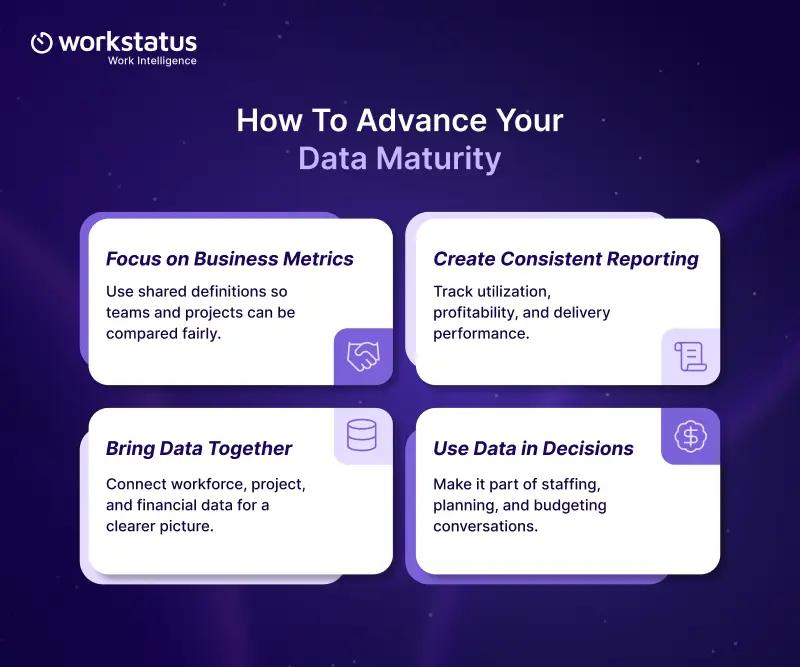
1. Bring Workforce and Project Data Together
Most visibility problems start with disconnected systems.
When workforce, project, and financial data are stored in separate systems, most decision-makers struggle to see what’s really happening.
Bringing that information together creates a clearer picture of delivery performance, resource utilization, capacity, and profitability.
Modern workforce intelligence software helps connect these data sources and make them easier to use.
2. Focus on Business Metrics
Track metrics that directly affect performance:
- Resource utilization
- Employee productivity
- Project profitability
- Client profitability
- Delivery performance
- Capacity trends
These metrics provide a clearer view of business health than hours worked alone.
3. Create Consistent Reporting
Different teams often define and report metrics differently.
A structured data analytics maturity model depends on consistent reporting and shared definitions.
Without consistency, comparing performance across teams and projects becomes difficult.
4. Use Data During Decision-Making
Data should not sit inside reports waiting to be reviewed.
It should be part of conversations about staffing, delivery, planning, budgeting, and growth.
That’s where the real value comes from.
How Workstatus Supports Your Data Maturity Journey
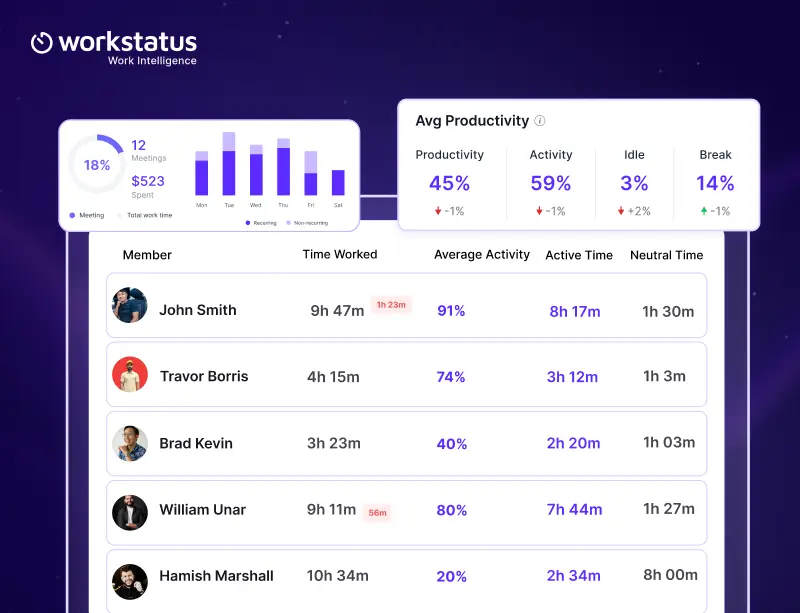
Moving from basic reporting to better decision-making requires visibility across the workforce, projects, and operations.
Workstatus helps service businesses:
- See workloads, capacity, and utilization in one place
- Connect workforce activity to project performance
- Optimize resource utilization to improve productivity
- Identify delivery risks earlier
- Improve forecasting and resource planning
- Support faster operational decision-making
Workstatus combines workforce tracking, workforce analytics, and reporting into a single platform.
As a work intelligence software, it helps you connect workforce activity to business outcomes.
It also functions as a productivity-visibility software, helping organizations identify utilization gaps, workload imbalances, and delivery risks before they become larger problems.
Instead of managing through disconnected reports, you get a clearer view of what’s happening across teams, projects, and clients.
Conclusion
Most service businesses don’t have a data collection problem. They have a visibility problem. The information already exists across timesheets, project systems, workforce tools, and financial reports. The challenge is turning that information into decisions. A well-defined data maturity model helps organizations do exactly that.
As visibility improves, you can plan resources more effectively, identify risks earlier, improve utilization, strengthen project profitability, and support better business outcomes.
Whether you call it a data maturity model or a data analytics maturity model, the goal remains the same. The goal is to turn operational data into decisions that improve performance.
Better business decisions don’t come from having more data. They come from understanding what the data is telling you.
Workstatus supports this journey by providing the workforce visibility, reporting, and analytics businesses need to turn everyday operational data into measurable results.
FAQs
1. What is a data maturity model for service businesses?
Ans. A data maturity model shows how effectively a business collects, analyzes, and uses data to make decisions. The higher the maturity level, the more value a business gets from its data.
2. How do service businesses turn employee time logs into better business decisions?
Ans. Service businesses can turn employee time logs into better decisions by
- Knowing how time is spent across projects
- Measuring team utilization
- Comparing planned vs. actual effort
- Identifying productivity trends
- Analyzing project profitability
This helps managers make better decisions about staffing, budgeting, and project planning.
3. How do I know if my business is using time tracking data effectively?
Ans. You are likely using time tracking data effectively if you:
- Review data regularly
- Use it for resource planning
- Track project performance
- Measure utilization and productivity
- Make decisions based on insights rather than assumptions
If time data is only used for payroll or attendance, there is more room for improvement.
4. What are the stages of data maturity?
Ans. The main stages of data maturity are
- Data Collection – Gather workforce data.
- Data Visibility – Track data through reports and dashboards.
- Data Analysis – Identify trends and patterns.
- Data-Driven Decisions – Use insights to improve planning and execution.
- Continuous Optimization – Refine operations based on data insights.
5. Which workforce metrics matter beyond work hours?
Ans. Service businesses should preferably track the following metrics:
- Utilization rate
- Billable vs. non-billable time
- Productivity trends
- Project completion rates
- Resource capacity
- Project profitability
- Team workload distribution
- Overtime levels
- Employee workhours
These metrics provide a more complete view of workforce performance.
6. How do businesses turn raw time tracking data into actionable insights?
Ans. A business can turn raw time tracking data into actionable insights by using the following steps:
- Combine time data with project and financial data
- Monitor trends over time
- Compare performance across teams and projects
- Track utilization and productivity metrics
- Use dashboards and reports to identify opportunities for improvement
The goal is to turn data into actions that improve efficiency and business outcomes.
7. What are the signs that your business has low workforce data maturity?
Ans. Common signs of low workforce data maturity include:
- Decisions are based mostly on intuition
- Time data is rarely reviewed
- Teams use disconnected systems
- Resource planning is inconsistent
- Project overruns are common
These issues often indicate that data is being collected but not fully used.
8. How do I build a data-driven workforce management strategy?
Ans. Some key steps for building a data-driven workforce management strategy are as follows:
- Defining key business goals
- Tracking relevant workforce metrics
- Collecting consistent and accurate data
- Creating regular reporting processes
- Using insights for staffing and project decisions
- Reviewing performance regularly
- Continuously improving based on results
A successful strategy focuses on using workforce data to support better operational and business decisions.