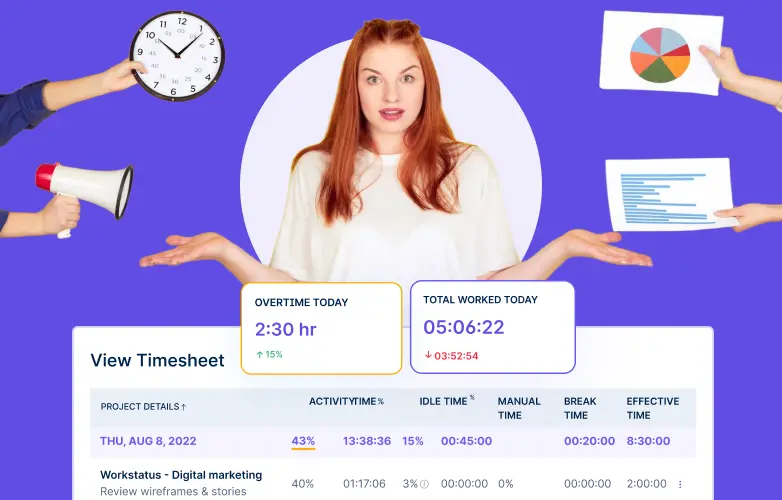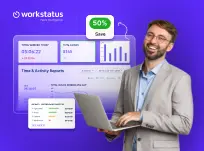
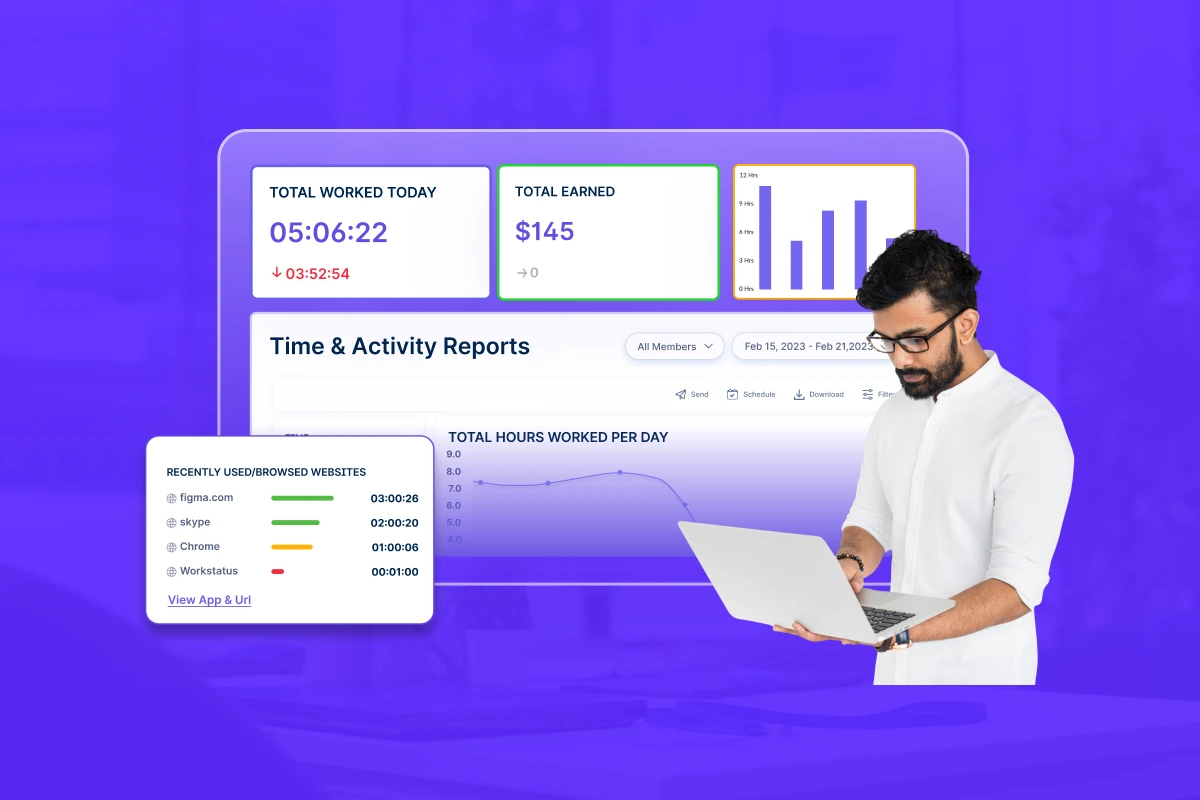
Tool Stack Audit: Save 50% With Smarter Workforce Management Software
Are you using different tools for time tracking, task management, productivity monitoring, and payroll? If yes, then you’re likely facing...
Are you using different tools for time tracking, task management, productivity monitoring, and payroll? If yes, then you’re likely facing...
Ever wish you could keep an eye on your IT systems without running around the office? That’s exactly what Remote...
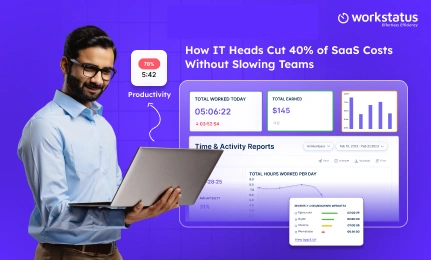
Many IT leaders look at their SaaS bills and wonder; Why are we paying for so much? You’re not alone....
Higher hours do not prove sincerity but hide inefficiency and stall success. Don’t you think counting the hours is only...
Running a business isn’t a sprint. It is indeed a relentless stretch of quick decisions, long work nights, and juggling...
Are you witnessing your team’s declining motivation? Could this be due to a delayed payout or something else? In most...
Nearly 78% of employers now use monitoring tools to oversee remote staff. 86% implement real-time tracking of apps and screen...
A well-established IT company switched to full-time remote work, and things initially looked smooth. However, employees felt disconnected, some left,...
Being a CEO or founder of a business that has mobilized teams worldwide can be challenging without the right tools...
Managing team resources is tough. One small mistake can lead to overworked staff or missed deadlines. Key challenges include: Tracking...
Effective scheduling should align with employee preferences to boost productivity and morale. Flex Time and Comp Time are two popular...
Running a business is not just about hard work, it is about working smart. Without the right systems in place, time, money...

Get a 7-day free FULL FEATURE trial of Workstatus now. Boost efficiency, accountability, and results – anytime, anywhere.
![How to Calculate Payroll? [+ Free Templates]](https://www.workstatus.io/blog/wp-content/uploads/2025/07/Thumbnail-204x151-2-1.webp)