Table of Contents
Have you ever considered that you ended a very busy workday with your teams doing a lot, but still, for some reason, you can’t clearly say what actually moved the business forward?
This is quite a challenge that many service leaders face. Tasks are happening everywhere, like:
- Frequent meetings
- Repeated project changes
- Urgent client requests
- Admin work
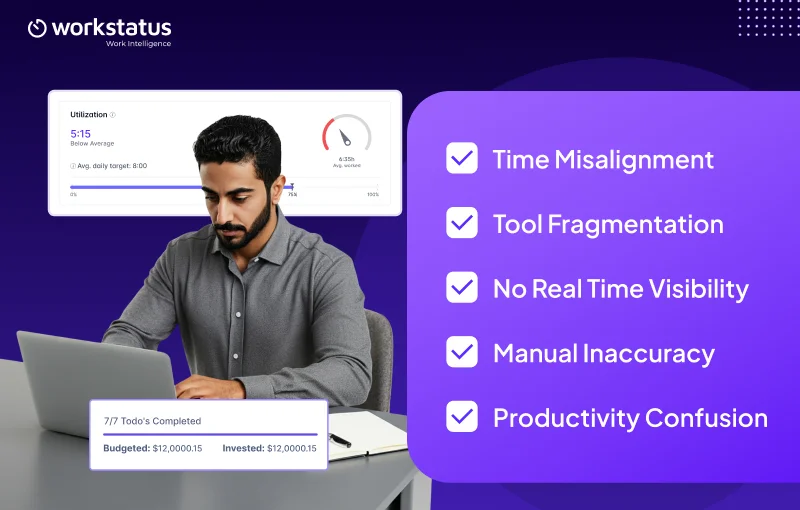
But when the time comes to check margins and project health, clarity is missing.
- Billable output is low
- Budget overruns are shown late
- Delivery pressure keeps rising
- No clear utilization view
The real shift happens only when you start connecting your daily effort with the real business outcomes, such as margins, capacity, and delivery speed.
So, in this blog, you’ll get to know about how utilization visibility is a growing challenge for service businesses and how you can regain control by improving visibility.
What is Utilization Visibility (And Why It Matters)
You might just assume utilization visibility is just another metric, but no, for service businesses, it is a medium that helps in deciding how profitable and predictable delivery really is.
It is not about the tracking, like how many hours your team works. It basically gives you a clear picture of how time contributes to real client delivery and business results through team capacity utilization.
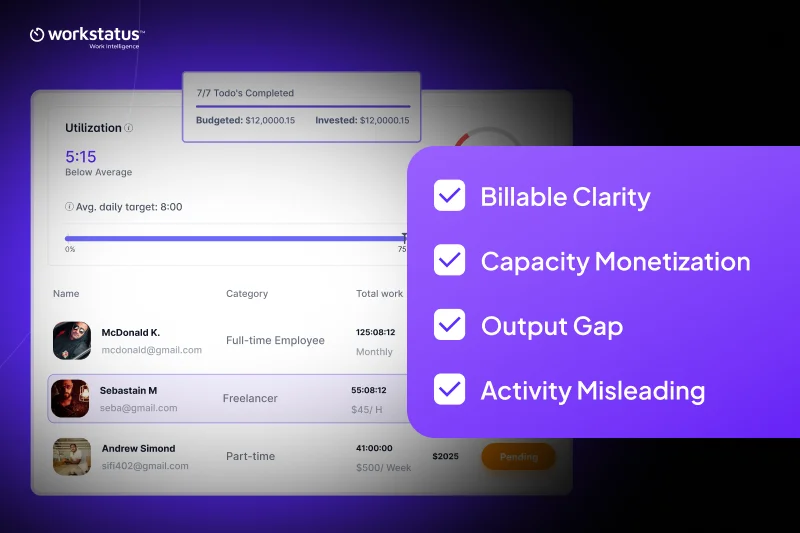
- You get a clear view of billable vs non-billable time across projects
- Solid understanding of how team capacity turns revenue into margins
- Clear up the gaps between tracked hours and actual output
- Quick realization that high activity does not always mean high productivity
It’s simple to understand that, if the utilization becomes visible, leaders stop assuming and start planning with confidence. It gives you the direct link between project performance, daily efforts, and business growth.
Now that we are aware of what exactly utilization visibility is and why it matters a lot in service businesses, let’s just figure out what the real challenge is for visibility breakdown.
The Real Problem: Why Visibility Breaks Down
In the beginning, everything is very smooth and feels manageable. Projects are fewer, teams are smaller, and leaders have that clarity of who is doing what.
But, as the business starts growing, the clarity fades away. Here’s what exactly happens:
- No clear view of time spent on client work, limiting ability to improve team utilization
- Work is scattered across the various tools, which results in no clear delivery view
- There is a lack of real-time tracking and reporting
- No real efforts get captured due to manual timesheets
- Zero understanding of productive vs non-productive hours
With time, the leaders don’t get that clear signal because they start seeing it as a confusing number. That is where the visibility gap starts impacting planning, delivery confidence, and overall margins.
Before we begin further, we need to know what exactly the signs are of why your business lacks utilization visibility.
Signs Your Business Lacks Utilization Visibility
Now that you clearly know the problem, it’s important to pause and look for the signs that impact your business operations:
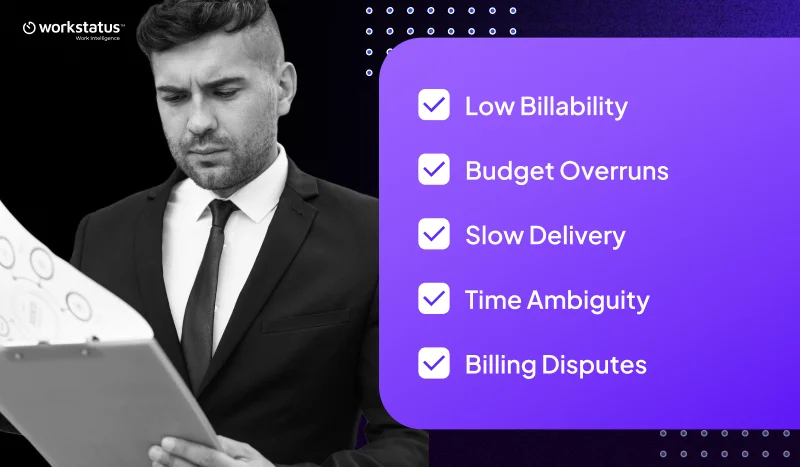
- High hours, low billable impact; gaps in workforce utilization tracking
- The budget gets exceeded without any early warning
- People in the team are busy throughout the day, but still, the overall delivery speed is lower
- There is no clarity on where the time is actually going and is spent
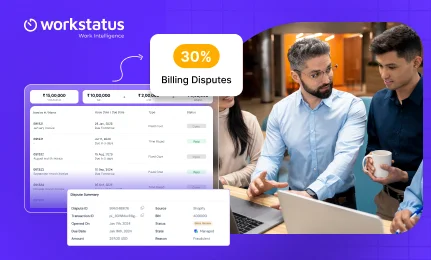
- High billing disputes due to unclear and inconsistent work records
When you see these signs coming together, it usually tells you that you have a deeper visibility gap.
But what if I tell you there is a solution to improve your resource utilization visibility? The process is very easy; you just need a few key metrics that actually help to improve utilization, but with the help of the workforce intelligence platform.
Let’s just see what wonders it does.
Key Metrics That Actually Improve Utilization
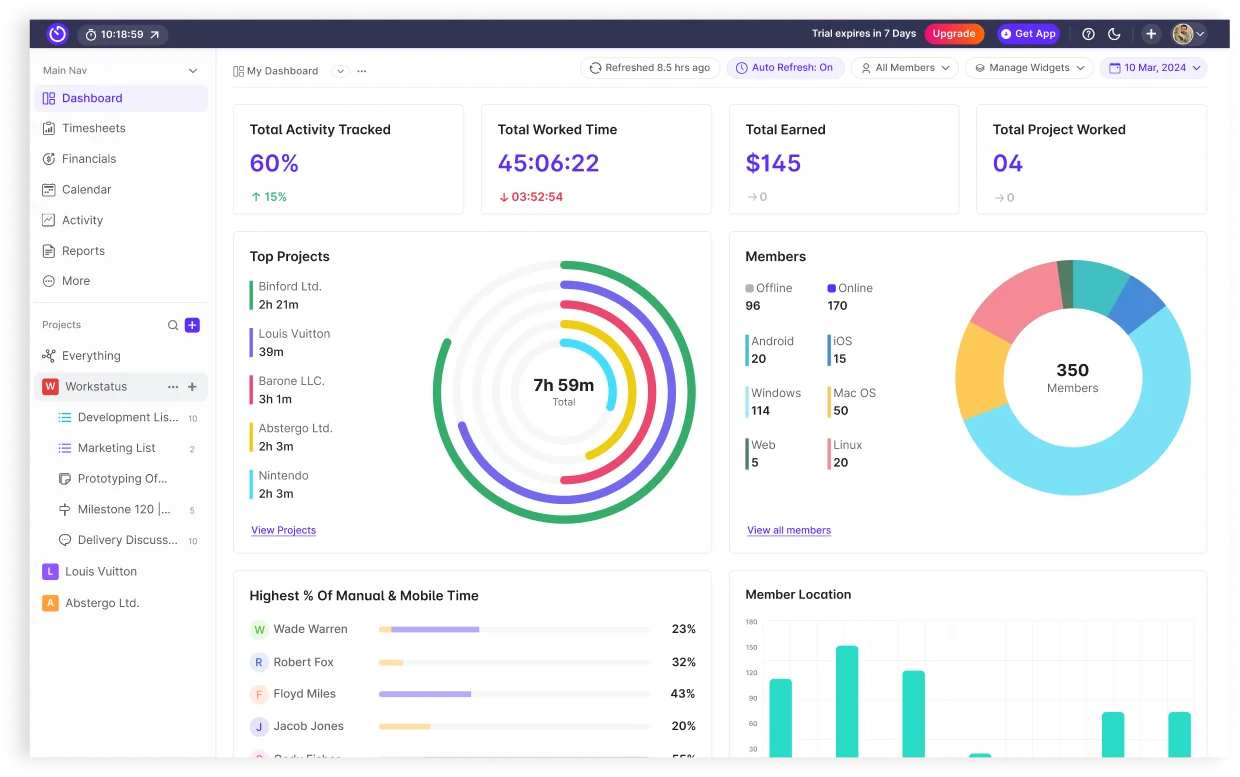
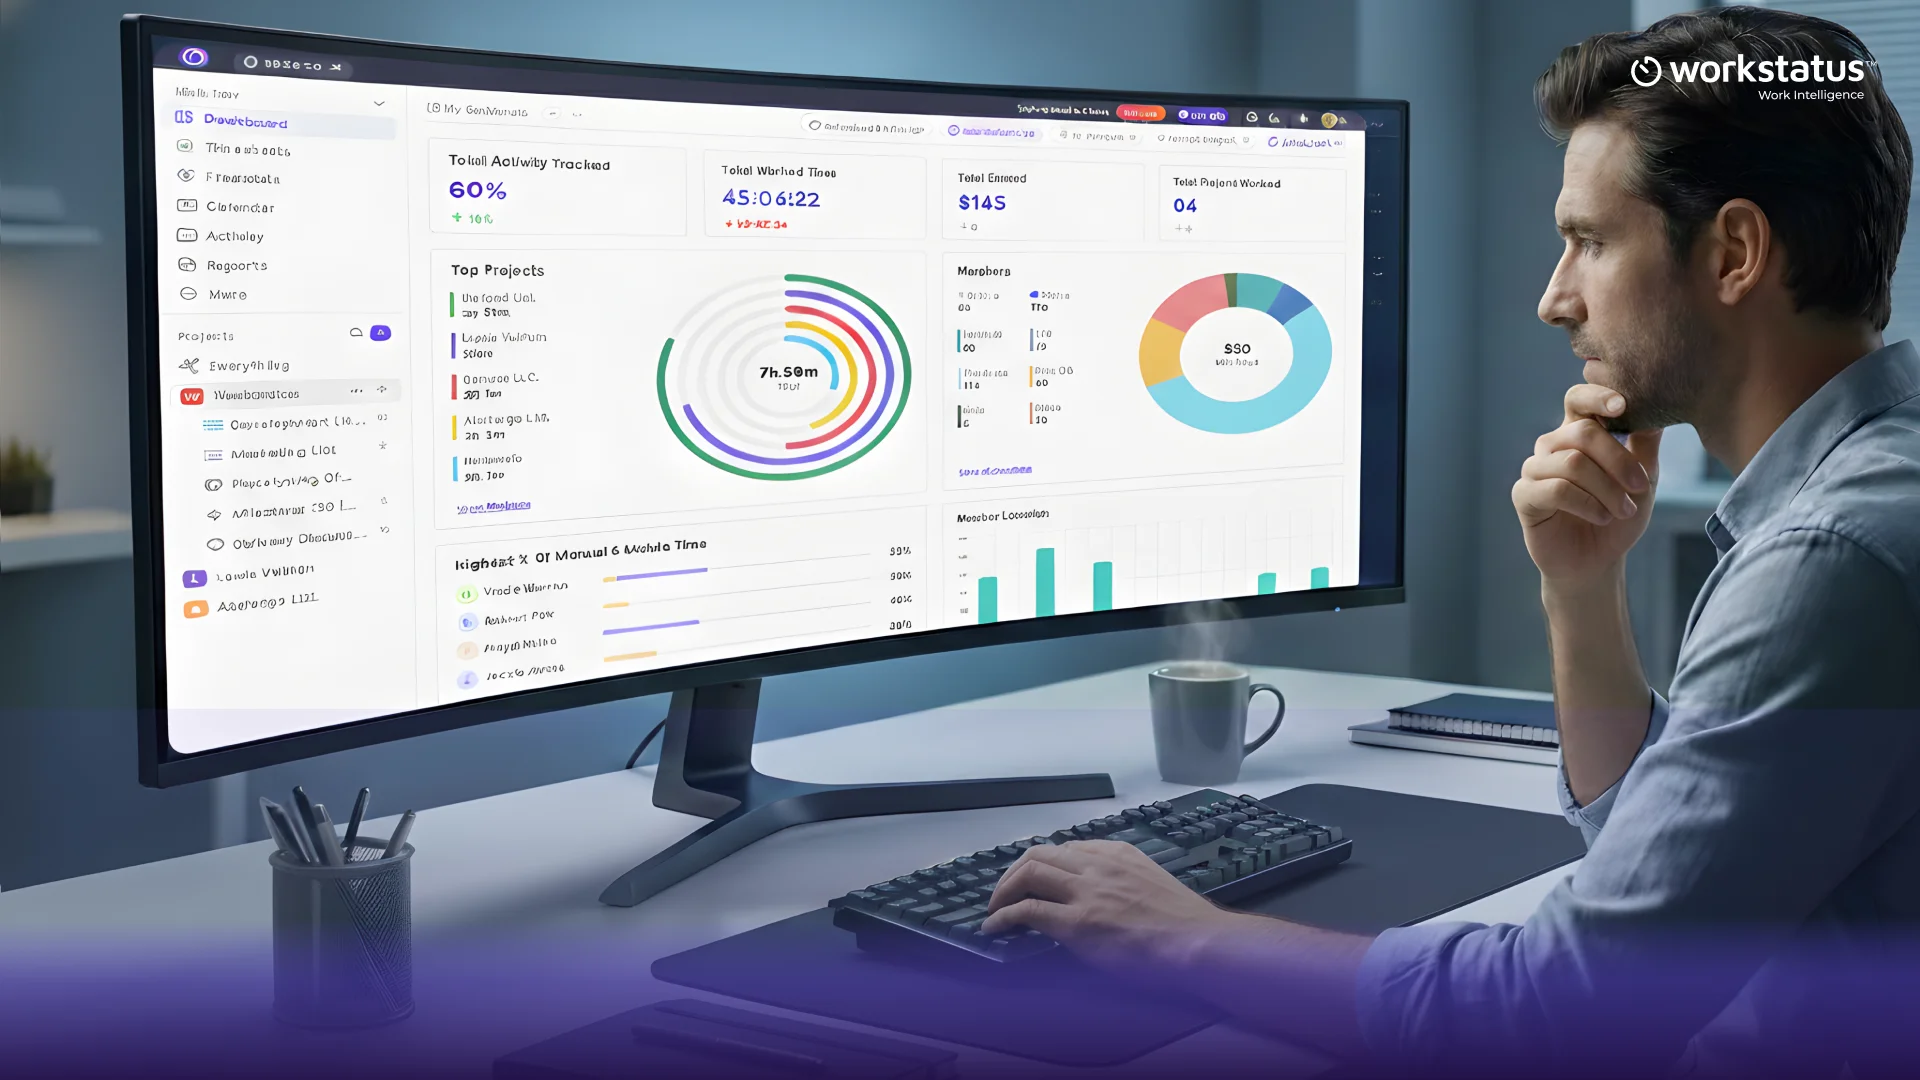
It’s important to gain the right visibility into how your team works. This is where “Workstatus” comes into the picture.
It brings you clarity, structure, and real-time understanding of the effort across projects and teams
Instead of just relying on the scattered reports or delayed reports, the leaders can just focus on key utilization metrics, which give them the best delivery performance and profitability.
Want to calculate your team utilization quickly? Check here
Here are the key metrics by Workstatus that actually improve utilization:
Billable Utilization Rate
It shows you the total time spent by your team on revenue-generating client work
Effective Hourly Rate (EHR)
It helps you understand whether the effort invested in the project is delivering the expected financial return or not
Project Profitability
Gives visibility into the utilization levels and how they impact your overall margins and project success
Time Variance (Estimated vs Actual)
Improves future planning accuracy to highlight the gaps between planned effort and actual time spent
Idle vs Productive Time Ratio
Gives you an easier view of how effectively team capacity is used across different engagements and tasks.
This is how utilization visibility can get a lot simpler when you have the right workflow intelligence platform.
But, as you know, the real proof lies in the outcomes. So, let’s move forward and see the real results that team utilization tracking with Workstatus has shown.
Real Business Outcomes You Can Expect
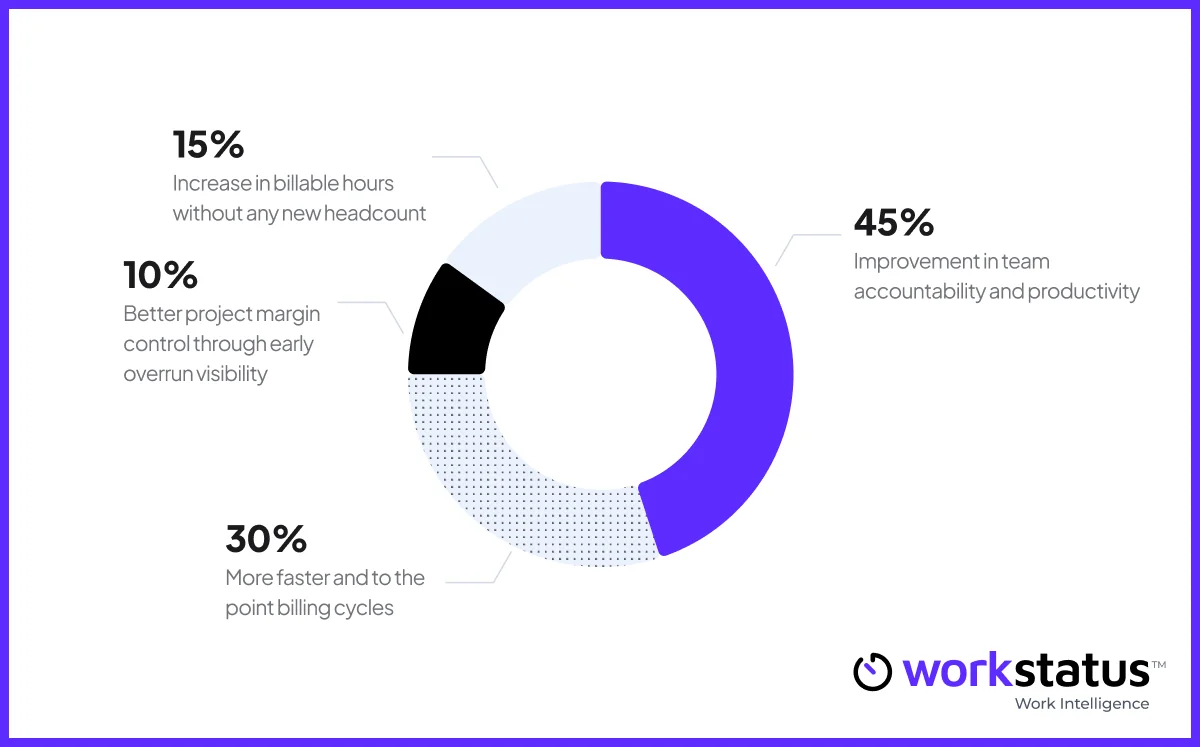
The real business outcomes you can expect with the right key metrics are:
- 15% increase in billable hours without any new headcount
- 10% better project margin control through early overrun visibility
- 30% more faster and to the point billing cycles
- 45% improvement in team accountability and productivity
So, now you clearly know about the right metric and how they improve employee utilization, so the next step is to apply them right away without any bottlenecks.
But for that, just look at some common mistakes to avoid in the next section.
Common Mistakes to Avoid
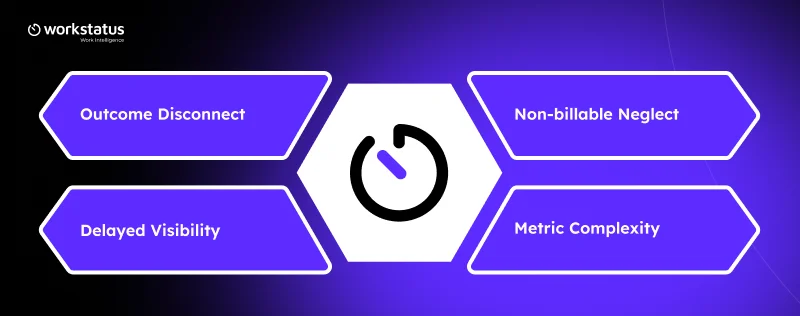
Here are some common mistakes that you might avoid. Let’s look at them once:
- Tracking the hours without any link to the real project outcomes
- Ignoring the non-billable time patterns often
- Not looking at the real-time insights and depending on the delayed reporting
- Making the utilization metric very overcomplicated
Avoiding these common mistakes helps your team turn employee utilization tracking into a practical growth advantage.
Final thoughts
Utilization clarity is one factor that can change your service business completely in terms of growth and delivery.
With structured insights from tools like Workstatus, teams can turn their daily effort into stronger margins and more upfront decisions.
So, what are you waiting for? Switch to smarter utilization visibility today and start turning effort into real business results.
FAQs
Ques: What do you mean by utilization visibility?
Ans: It is simply the clarity on how your team’s time is used across billable and non-billable work, enabled by employee utilization software.
Ques: How to track employee utilization?
Ans: Track where time goes, separate billable work, and monitor utilization in real time.
Ques: Why does the utilization visibility matter?
Ans: It matters because it improves margins, delivery planning, and project profitability.
Ques: What are the common signs of poor utilization visibility?
Ans: The common signs of poor utilization visibility would be lower billable hours output, budget overruns, delayed delivery, and unclear work tracking.
Ques: How can service teams improve utilization?
Ans: The service teams can improve utilization by using the real metrics and work intelligence tools like Workstatus.