Employee Monitoring Software
Beyond employee monitoring.
See outcomes, not activity.
Monitoring tells you when people work. It can't tell you whether it matters.
- Real-time activity monitoring & productivity insights
- Employee-visible. No keystroke logging. No hidden scoring.
- Secure, easy to use, and built for remote & in-office teams.
Monitoring tells you when people work
It can tell you whether it matters.
Three things every monitoring buyer discovers too late.
Activity data is not delivery data
Your monitoring tool shows 8 hours logged. It can't tell you those 8 hours put your most important project 15% over budget. “The team looked busy right up to the overrun.”
Your best engineers will notice — and leave
Engineers who know they're being surveilled game the metrics or start looking for another job. You get activity data and a team that's quietly disengaged.
You still can't see the actual risks
Burnout, project overrun, workload imbalance: none of these show up in a screenshot feed. They show up in the resignation letter or the client escalation, 90 days too late to prevent.
Every project. Every signal.
All in one view.
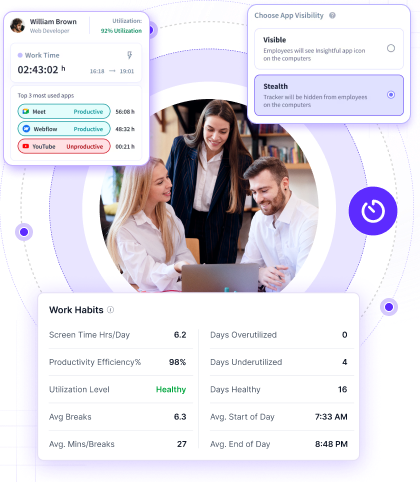
Your delivery head’s morning dashboard — budget health, workload, delivery risk, before the first standup.
The difference between
knowing and guessing.
You see when people are online, which apps are open, how long they were idle. You still don’t know whether the project will deliver.
“We had a monitoring tool. Engineers hated it. Attrition went up 30%. We replaced it with Workstatus and within 60 days our best engineers said it felt fair.”
Head of Engineering — SaaS delivery firm, Bangalore (85 engineers)
You see margin by project, workload health, burnout signals, delivery risk. Every employee sees their own data too. Trust goes up. Outcomes improve.
“I was worried when we started using Workstatus. Then I saw my own dashboard. It’s not about watching me. It’s about helping the team work better.”
Senior Developer — IT services firm, 120 engineers
What intelligence looks like.
Instead of surveillance.
Every signal visible to the employee. Every pattern visible to the manager.
Outcome Visibility
See which projects are at risk and which teams drive delivery — not which apps are open.
Built for Human Trust
Full transparency to employees — every person sees their own data. No hidden tracking, no screenshots.
Early Warning Signals
Burnout, overrun, and workload risk surface weeks early — when you can still act, not after attrition.
Numbers from service teams
in the first 90 days.
Measured from customer deployments. Not projections.
increase in billable hours recovered in first 90 days
average time to detect project drift before the client conversation
reduction in manual reporting time per project lead
We were running blind on project margin. Every month we’d rebuild the same spreadsheet — and by then it was too late. Now we see budget drift in week 2, not after the engagement closes.
Built for trust
in both directions.
Connect. See. Act.
28 minutes to first insight.
Replace surveillance with visibility
Connect your project stack — Jira, Asana, ClickUp, or Workstatus natively. Your team’s dashboard activates immediately. Every employee sees their own data from day one.
Work captures automatically
Time maps to projects at the app level, silently, in the background. No timers, no manual logs. Workstatus connects those hours to outcomes.
Your team sees their data. You see the patterns.
Budget drift surfaces in week 2, not at billing. Workload imbalances appear before burnout. Weekly intelligence report sent automatically every Friday.
Questions every buyer asks.
Answered honestly.
The objections your team will raise — resolved before the first meeting.
Intelligence instead of surveillance.
Try it free for 7 Days.
7-day free trial. No credit card. Connects in 28 minutes.